Types of Charts
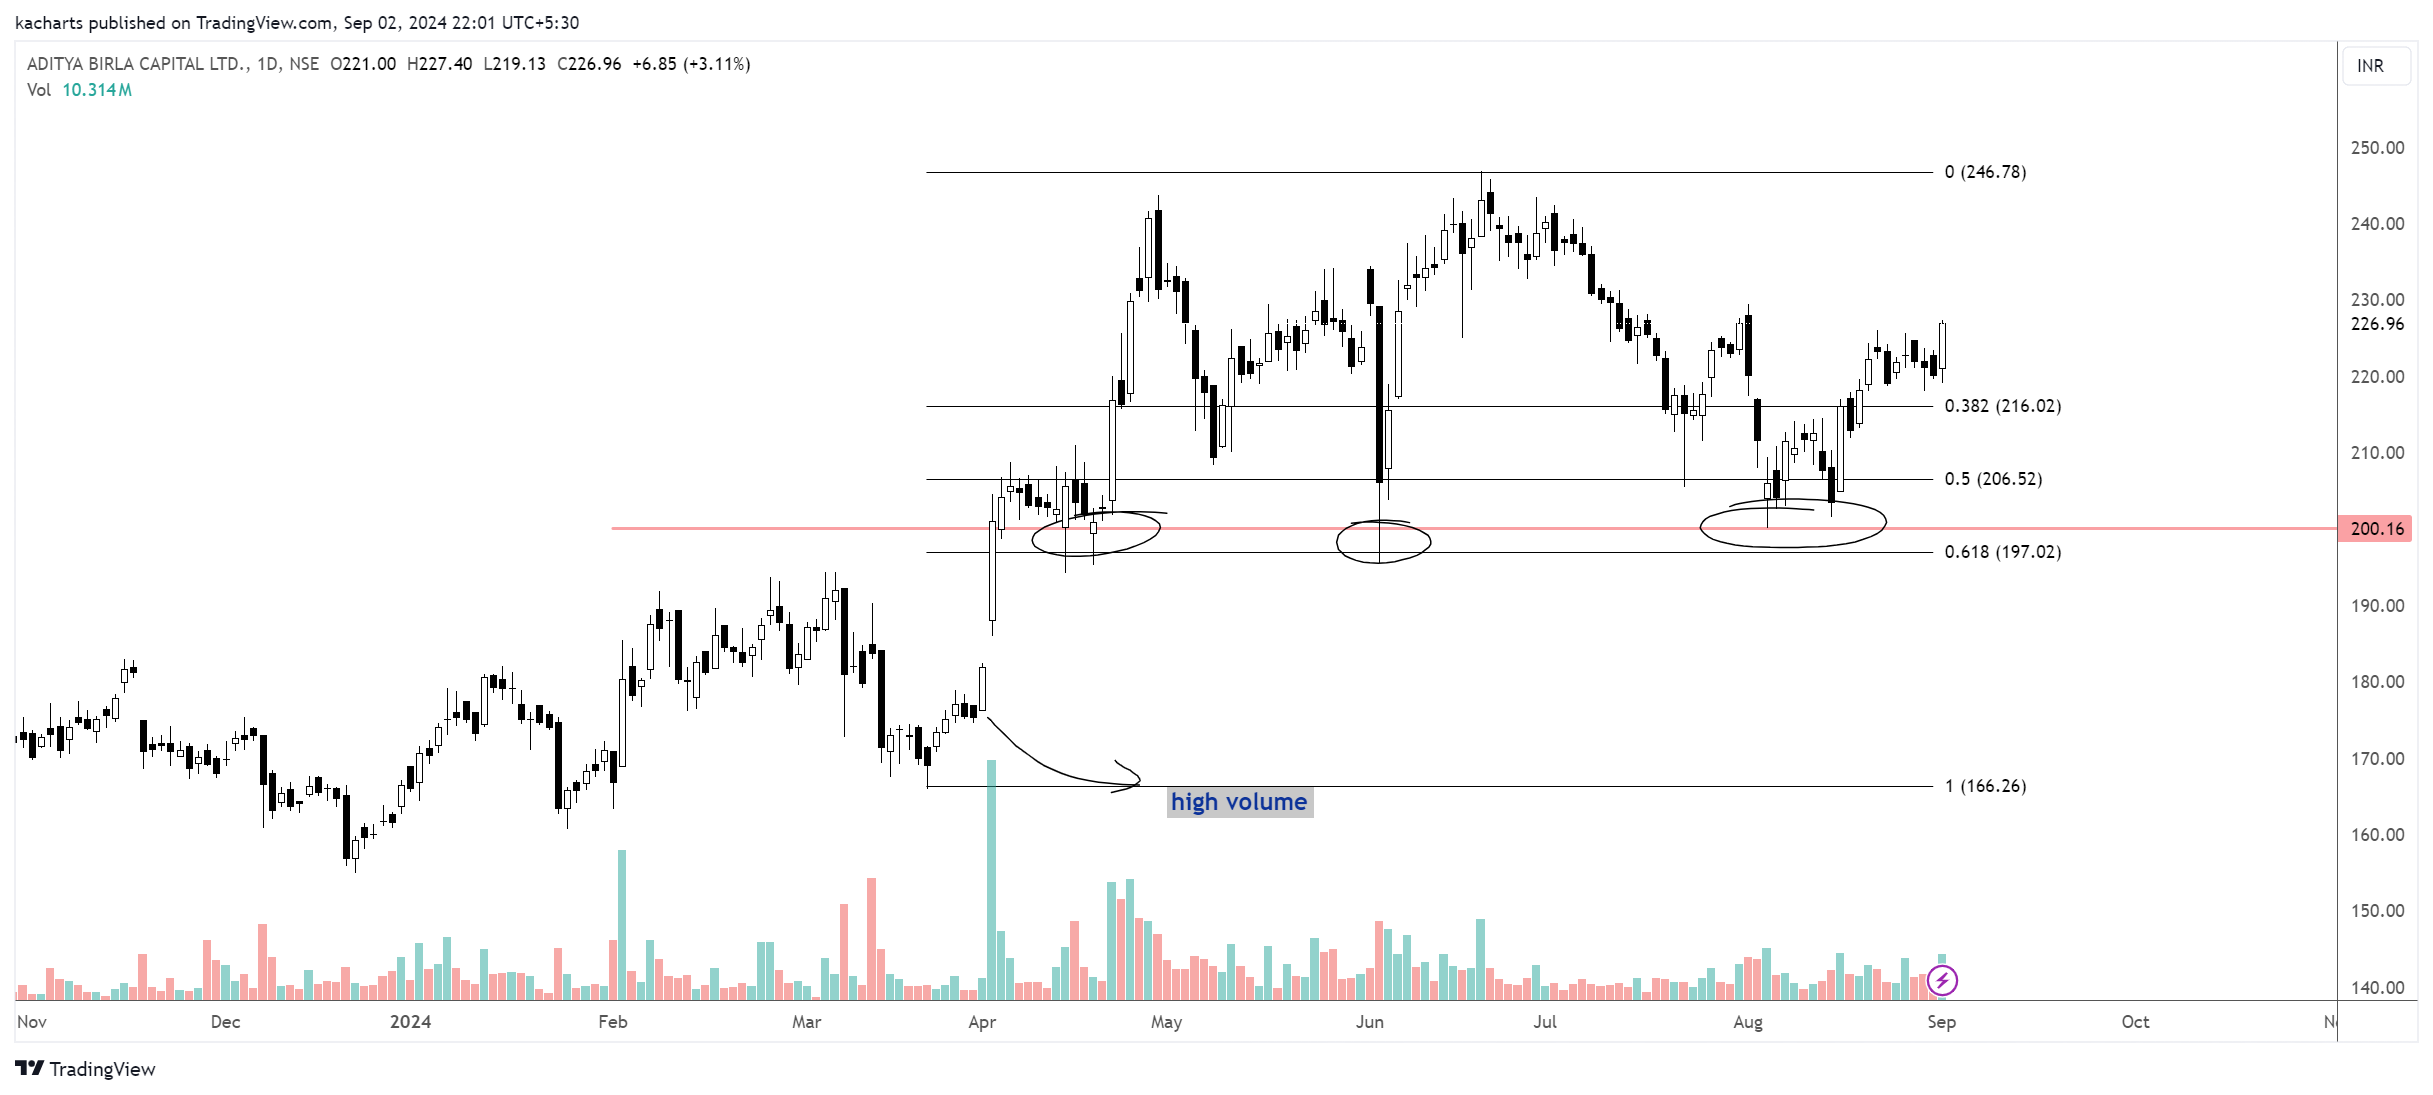
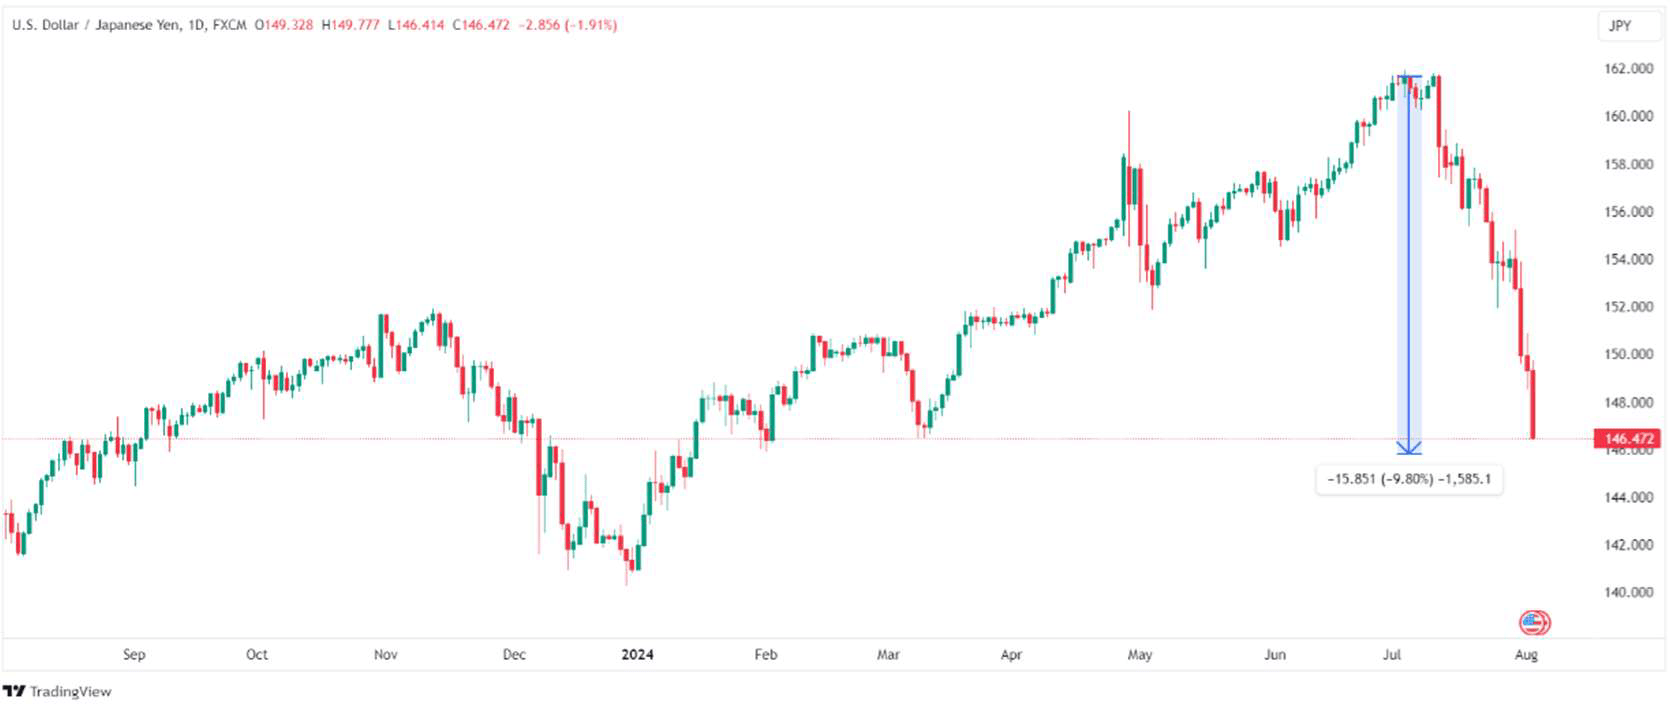
Charts are the indispensable part of technical analysis. They are the best means to capture price movement of any security or indices. They are two dimensional graphical presentation of the historical price fluctuations. In their most popular forms, they represent the price in an X-Y plane with price scaled on Y-axis (vertical) and time on…


Related posts
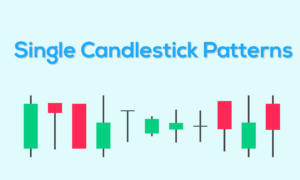
As the name suggests, single candlestick patterns involve only one candle. It means that only... Continue reading

Technical analysis is the study of market actions, primarily through the use of charts, for... Continue reading